图书简介
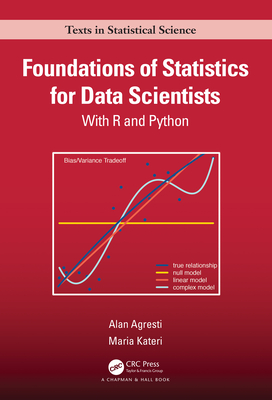
Designed as a textbook for a one or two-term introduction to mathematical statistics for students training to become data scientists, Foundations of Statistics for Data Scientists: With R and Python is an in-depth presentation of the topics in statistical science with which any data scientist should be familiar, including probability distributions, descriptive and inferential statistical methods, and linear modelling. The book assumes knowledge of basic calculus, so the presentation can focus on ’why it works’ as well as ’how to do it.’ Compared to traditional "mathematical statistics" textbooks, however, the book has less emphasis on probability theory and more emphasis on using software to implement statistical methods and to conduct simulations to illustrate key concepts. All statistical analyses in the book use R software, with an appendix showing the same analyses with Python.The book also introduces modern topics that do not normally appear in mathematical statistics texts but are highly relevant for data scientists, such as Bayesian inference, generalized linear models for non-normal responses (e.g., logistic regression and Poisson loglinear models), and regularized model fitting. The nearly 500 exercises are grouped into "Data Analysis and Applications" and "Methods and Concepts." Appendices introduce R and Python and contain solutions for odd-numbered exercises. The book’s website has expanded R, Python, and Matlab appendices and all data sets from the examples and exercises.Alan Agresti, Distinguished Professor Emeritus at the University of Florida, is the author of seven books, including Categorical Data Analysis (Wiley) and Statistics: The Art and Science of Learning from Data (Pearson), and has presented short courses in 35 countries. His awards include an honorary doctorate from De Montfort University (UK) and the Statistician of the Year from the American Statistical Association (Chicago chapter). Maria Kat
Table of Contents: Foundations of Statistical Science for Data Scientists Alan Agresti and Maria Kateri 1. Introduction to Statistical Science 1.1 Statistical science: Description and inference Design, descriptive statistics, and inferential statistics Populations and samples Parameters: Numerical summaries of the population Defining populations: actual and conceptual 1.2 Types of data and variables Data files Example: The General Social Survey (GSS) Variables Quantitative variables and categorical variables Discrete variables and continuous variables Associations: response variables and explanatory variables 1.3 Data collection and randomization Randomization Collecting data with a sample survey Collecting data with an experiment Collecting data with an observational study Establishing cause and effect: observational versus experimental studies 1.4 Descriptive statistics: Summarizing data Example: Carbon dioxide emissions in European nations Frequency distribution and histogram graphic Describing the center of the data: mean and median Describing data variability: standard deviation and variance Describing position: percentiles, quantiles, and box plots 1.5 Descriptive statistics: Summarizing multivariate data Bivariate quantitative data: The scatterplot, correlation, and regression Bivariate categorical data: Contingency tables Descriptive statistics for samples and for populations 1.6 Chapter summary Exercises 2. Probability Distributions 2.1 Introduction to probability Probabilities and long-run relative frequencies Sample spaces and events Probability axioms and implied probability rules Example: Diagnostics for disease screening Bayes’ theorem Multiplicative law of probability, and independent events 2.2 Random variables and probability distributions Probability distributions for discrete random variables Example: Geometric probability distribution Probability distributions for continuous random variables Example: Uniform distribution Probability functions (pdf, pmf) and cumulative distribution function (cdf) Example: Exponential random variable Families of probability distributions indexed by parameters 2.3 Expectations of random variables Expected value and variability of a discrete random variable Expected values for continuous random variables Example: Mean and variability for uniform random variable Higher moments: Skewness Expectations of linear functions of random variables Standardizing a random variable 2.4 Discrete probability distributions Binomial distribution Example: Hispanic composition of jury list Mean, variability, and skewness of binomial distribution Example: Predicting results of a sample survey The sample proportion as a scaled binomial random variable Poisson distribution Poisson variability and overdispersion 2.5 Continuous probability distributions The normal distribution The standard normal distribution Examples: Finding normal probabilities and percentiles The gamma distribution The exponential distribution and Poisson processes Quantiles of a probability distribution Using the uniform to randomly generate a continuous random variable 2.6 Joint and conditional distributions and independence Joint and marginal probability distributions Example: Joint and marginal distributions of happiness and family income Conditional probability distributions Trials with multiple categories: the multinomial distribution Expectations of sums of random variables Independence of random variables Markov chain dependence and conditional independence 2.7 Correlation between random variables Covariance and correlation Example: Correlation between income and happiness Independence implies zero correlation, but not converse Bivariate normal distribution * 2.8 Chapter summary Exercises 3. Sampling Distributions 3.1 Sampling distributions: Probability distributions for statistics Example: Predicting an election result from an exit poll Sampling distribution: Variability of a statistic’s value among samples Constructing a sampling distribution Example: Simulating to estimate mean restaurant sales 3.2 Sampling distributions of sample means Mean and variance of sample mean of random variables Standard error of a statistic Example: Standard error of sample mean sales Example: Standard error of sample proportion in exit poll Law of large numbers: Sample mean converges to population mean Normal, binomial, and Poisson sums of random variables have the same distribution 3.3 Central limit theorem: Normal sampling distribution for large samples Sampling distribution of sample mean is approximately normal Simulations illustrate normal sampling distribution in CLT Summary: Population, sample data, and sampling distributions 3.4 Large-sample normal sampling distributions for many statistics * Delta method Delta method applied to root Poisson stabilizes the variance Simulating sampling distributions of other statistics The key role of sampling distributions in statistical inference 3.5 Chapter summary Exercises 4. Statistical Inference: Estimation 4.1 Point estimates and confidence intervals Properties of estimators: Unbiasedness, consistency, efficiency Evaluating properties of estimators Interval estimation: Confidence intervals for parameters 4.2 The likelihood function and maximum likelhood estimation The likelihood function Maximum likelihood method of estimation Properties of maximum likelihood estimators Example: Variance of ML estimator of binomial parameter Example: Variance of ML estimator of Poisson mean Sufficiency and invariance for ML estimators 4.3 Constructing confidence intervals Using a pivotal quantity to induce a confidence interval A large-sample confidence interval for the mean Confidence intervals for proportions Example: Atheists and agnostics in Europe Using simulation to illustrate long-run performance of CIs Determining the sample size before collecting the data Example: Sample size for evaluating an advertising strategy 4.4 Confidence intervals for means of normal populations The $t$ distribution Confidence interval for a mean using the $t$ distribution Example: Estimating mean weight change for anorexic girls Robustness for violations of normal population assumption Construction of $t$ distribution using chi-squared and standard normal Why does the pivotal quantity have the $t$ distribution? Cauchy distribution: t distribution with df=1 has unusual behavior 4.5 Comparing two population means or proportions A model for comparing means: Normality with common variability A standard error and confidence interval for comparing means Example: Comparing a therapy to a control group Confidence interval comparing two proportions Example: Does prayer help coronary surgery patients? 4.6 The bootstrap Computational resampling and bootstrap confidence intervals Example: Confidence intervals for library data 4.7 The Bayesian approach to statistical inference Bayesian prior and posterior distributions Bayesian binomial inference: Beta prior distributions Example: Belief in hell Interpretation: Bayesian versus classical intervals Bayesian posterior interval comparing proportions Highest posterior density (HPD) posterior intervals 4.8 Bayeian inference for means Bayesian inference for a normal mean Example: Bayesian analysis for anorexia therapy Bayesian inference for normal means with improper priors Predicting a future observation: Bayesian predictive distribution The Bayesian perspective, and empirical Bayes and hierarchical Bayes extensions 4.9 Why maximum likelihood and Bayes estimators perform well * ML estimators have large-sample normal distributions Asymptotic efficiency of ML estimators same as best unbiased estimators Bayesian estimators also have good large-sample performance The likelihood principle 4.10 Chapter summary Exercises 5. Statistical Inference: Significance Testing 5.1 The elements of a significance test Example: Testing for bias in selecting managers Assumptions, hypotheses, test statistic, P-value and conclusion 5.2 Significance tests for proportions and means The elements of a significance test for a proportion Example: Climate change a major threat? One-sided significance tests The elements of a significance test for a mean Example: Significance test about political ideology 5.3 Significance tests comparing means Significance tests for the difference between two means Example: Comparing a therapy to a control group Effect size for comparison of two means Bayesian inference for comparing means Example: Bayesian comparison of therapy and control groups 5.4 Significance tests comparing proportions Significance test for the difference between two proportions Example: Comparing prayer and non-prayer surgery patients Bayesian inference for comparing two proportions Chi-squared tests for multiple proportions in contingency table Example: Happiness and marital status Standardized residuals: Describing the nature of an association 5.5 Significance test decisions and errors The alpha-level: Making a decision based on the P-value Never ``accept H_0’’ in a significance test Type I and Type II errors As P(Type I error) decreases, P(Type II error) increases Example: Testing whether astrology has some truth The power of a test Making decisions versus reporting the P-value 5.6 Duality between significance tests and confidence intervals Connection between two-sided tests and confidence intervals Effect of sample size: Statistical versus practical significance Significance tests are less useful than confidence intervals Significance tests and P-values can be misleading 5.7 Likelihood-ratio tests and confidence intervals * The likelihood-ratio and a chi-squared test statistic Likelihood-ratio test and confidence interval for a proportion Likelihood-ratio, Wald, score test triad 5.8 Nonparametric tests A permutation test to compare two groups Example: Petting versus praise of dogs Wilcoxon test: Comparing mean ranks for two groups Comparing survival time distributions with censored data 5.9 Chapter summary Exercises 6. Linear Models and Least Squares 6.1 The linear regression model and its least squares fit The linear model describes a conditional expectation Describing variation around the conditional expectation Least squares model fitting Example: Linear model for Scottish hill races The correlation Regression toward the mean in linear regression models Linear models and reality 6.2 Multiple regression: Linear models with multiple explanatory variables Interpreting effects in multiple regression models Example: Multiple regression for Scottish hill races Association and causation Confounding, spuriousness, and conditional independence Example: Modeling the crime rate in Florida Equations for least squares estimates in multiple regression Interaction between explanatory variables in their effects Cook’s distance: Checking for unusual observations 6.3 Summarizing variability in linear regression models The error variance and chi-squared for linear models Decomposing variability into model explained and unexplained parts R-squared and the multiple correlation Example: R-squared for modeling Scottish hill races 6.4 Statistical inference for normal linear models The F distribution: Testing that all effects equal 0 Example: Linear model for mental impairment t tests and confidence intervals for individual effects Multicollinearity: Nearly redundant explanatory variables Confidence interval for E(Y) and prediction interval for Y The F test that all effects equal 0 is a likelihood-ratio test * 6.5 Categorical explanatory variables in linear models Indicator variables for categories Example: Comparing mean incomes of racial-ethnic groups Analysis of variance (ANOVA): An F test comparing several means Multiple comparisons of means: Bonferroni and Tukey methods Models with both categorical and quantitative explanatory variables Comparing two nested normal linear models Interaction with categorical and quantitative explanatory variables 6.6 Bayesian inference for normal linear models Prior and posterior distributions for normal linear models Example: Bayesian linear model for mental impairment Bayesian approach to the normal one-way layout 6.7 Matrix formulation of linear models The model matrix Least squares estimates and standard errors The hat matrix and the leverage Alternatives to least squares: Robust regression and regularization Restricted optimality of least squares: Gauss--Markov theorem Matrix formulation of Bayesian normal linear model 6.8 Chapter summary Exercises 7. Generalized Linear Models 7.1 Introduction to generalized linear models The three components of a generalized linear model GLMs for normal, binomial, and Poisson responses Example: GLMs for house selling prices The deviance Likelihood-ratio model comparison uses deviance difference Model selection: AIC and the bias/variance tradeoff Advantages of GLMs versus transforming the data Example: Normal and gamma GLMs for Covid-19 data 7.2 Logistic regression for binary data Logistic regression: Model expressions Interpreting beta_j: effects on probabilities and odds Example: Dose-response study for flour beetles Grouped and ungrouped binary data: Effects on estimates and deviance Example: Modeling Italian employment with logit and identity links Complete separation and infinite logistic parameter estimates 7.3 Bayesian inference for generalized linear models Normal prior distributions for GLM parameters Example: Bayesian logistic regression for endometrial cancer patients7.4 Poisson loglinear models for count data Poisson loglinear models Example: Modeling horseshoe crab satellite counts Modeling rates: Including an offset in the model Example: Lung cancer survival 7.5 Negative binomial models for overdispersed count data * Increased variance due to heterogeneity Negative binomial: Gamma mixture of Poisson distributions Example: Negative binomial modeling of horseshoe crab data 7.6 Iterative GLM model fitting * The Newton--Raphson method Newton--Raphson fitting of logistic regression model Covariance matrix of parameter estimates and Fisher scoring Likelihood equations and covariance matrix for Poisson GLMs 7.7 Regularization with large numbers of parameters Penalized likelihood methods Penalized likelihood methods: The lasso Example: Predicting opinions with student survey data Why shrink ML estimates toward 0? Dimension reduction: Principal component analysis Bayesian inference with a large number of parameters Huge n: Handling big data 7.8 Chapter summary Exercises % 8. Classification and Clustering 8.1 Classification: Linear Discriminant Analysis and Graphical Trees Classification with Fisher’s linear discriminant function Example: Predicting whether horseshoe crabs have satellites Summarizing predictive power: Classification tables and ROC curves Classification trees: Graphical prediction Logistic regression versus linear discriminant analysis and classification trees Other methods for classification: k-nearest neighbors and neural networks prediction 8.2 Cluster Analysis Measuring dissimilarity between observations on binary responses Hierarchical clustering algorithm and its dendrogram Example: Clustering states on presidential election outcomes 8.3 Chapter summary Exercises 9. Statistical Science: A Historical Overview 9.1 The evolution of statistical science Evolution of probability Evolution of descriptivev and inferential statistics 9.2 Pillars of statistical wisdom and practice Stigler’s seven pillars of statistical wisdom Seven pillars of wisdom for practicing data science Appendix A: Using R in Statistical Science Appendix B: Using Python in Statistical Science Appendix C: Brief Solutions to Odd-Numbered Exercises Bibliography Example Subject Index
Trade Policy 买家须知
- 关于产品:
- ● 正版保障:本网站隶属于中国国际图书贸易集团公司,确保所有图书都是100%正版。
- ● 环保纸张:进口图书大多使用的都是环保轻型张,颜色偏黄,重量比较轻。
- ● 毛边版:即书翻页的地方,故意做成了参差不齐的样子,一般为精装版,更具收藏价值。
关于退换货:- 由于预订产品的特殊性,采购订单正式发订后,买方不得无故取消全部或部分产品的订购。
- 由于进口图书的特殊性,发生以下情况的,请直接拒收货物,由快递返回:
- ● 外包装破损/发错货/少发货/图书外观破损/图书配件不全(例如:光盘等)
并请在工作日通过电话400-008-1110联系我们。
- 签收后,如发生以下情况,请在签收后的5个工作日内联系客服办理退换货:
- ● 缺页/错页/错印/脱线
关于发货时间:- 一般情况下:
- ●【现货】 下单后48小时内由北京(库房)发出快递。
- ●【预订】【预售】下单后国外发货,到货时间预计5-8周左右,店铺默认中通快递,如需顺丰快递邮费到付。
- ● 需要开具发票的客户,发货时间可能在上述基础上再延后1-2个工作日(紧急发票需求,请联系010-68433105/3213);
- ● 如遇其他特殊原因,对发货时间有影响的,我们会第一时间在网站公告,敬请留意。
关于到货时间:- 由于进口图书入境入库后,都是委托第三方快递发货,所以我们只能保证在规定时间内发出,但无法为您保证确切的到货时间。
- ● 主要城市一般2-4天
- ● 偏远地区一般4-7天
关于接听咨询电话的时间:- 010-68433105/3213正常接听咨询电话的时间为:周一至周五上午8:30~下午5:00,周六、日及法定节假日休息,将无法接听来电,敬请谅解。
- 其它时间您也可以通过邮件联系我们:customer@readgo.cn,工作日会优先处理。
关于快递:- ● 已付款订单:主要由中通、宅急送负责派送,订单进度查询请拨打010-68433105/3213。
本书暂无推荐
本书暂无推荐


